Training guides
Each section includes a short video and a downloadable guide to help you get the most out of the Calculator.
About the On-Farm Emissions Calculator
Learn what the Calculator does, how it works, and how it uses the Farm Emissions Method (FEM) to estimate your greenhouse gas emissions.
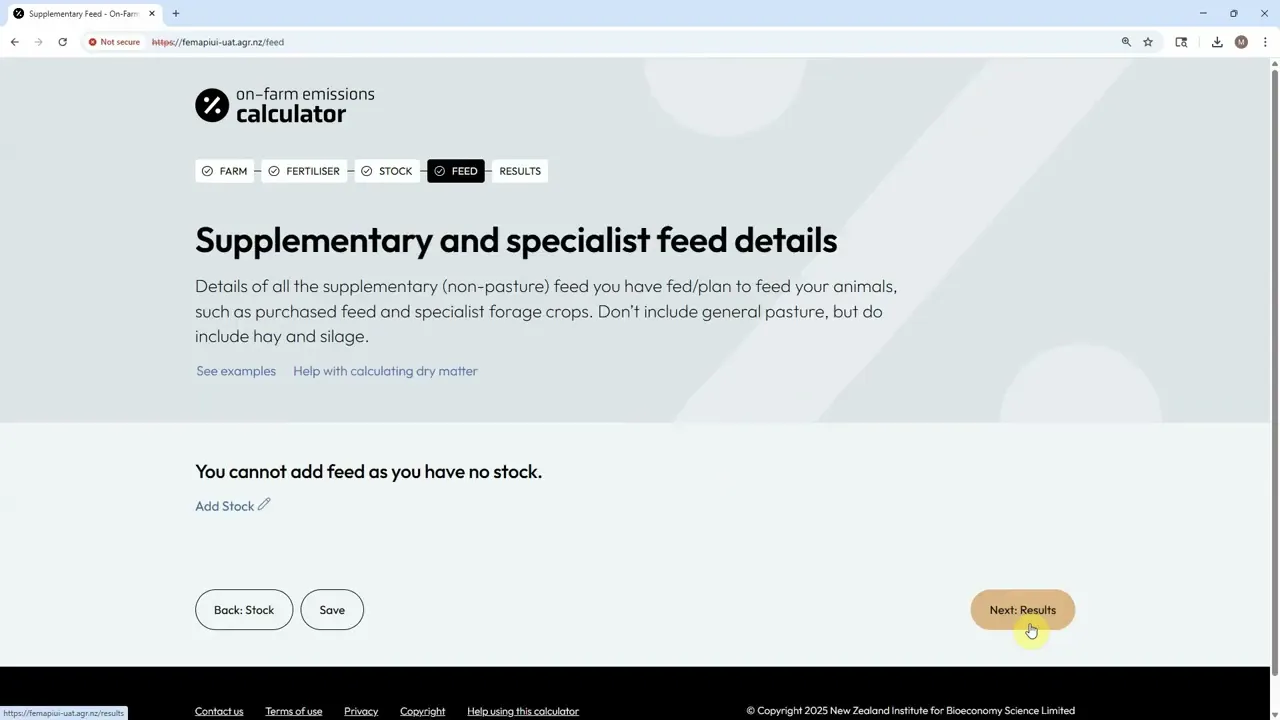
Entering your data and calculating your results
Step-by-step instructions for entering farm details — including stock numbers, fertiliser use, feed, milk production, and effluent management — and running your calculation.
Creating and managing your account
How to log in, manage access, and keep your account secure. Includes tips for managing multiple farms and reports within your account.
Frequently asked questions
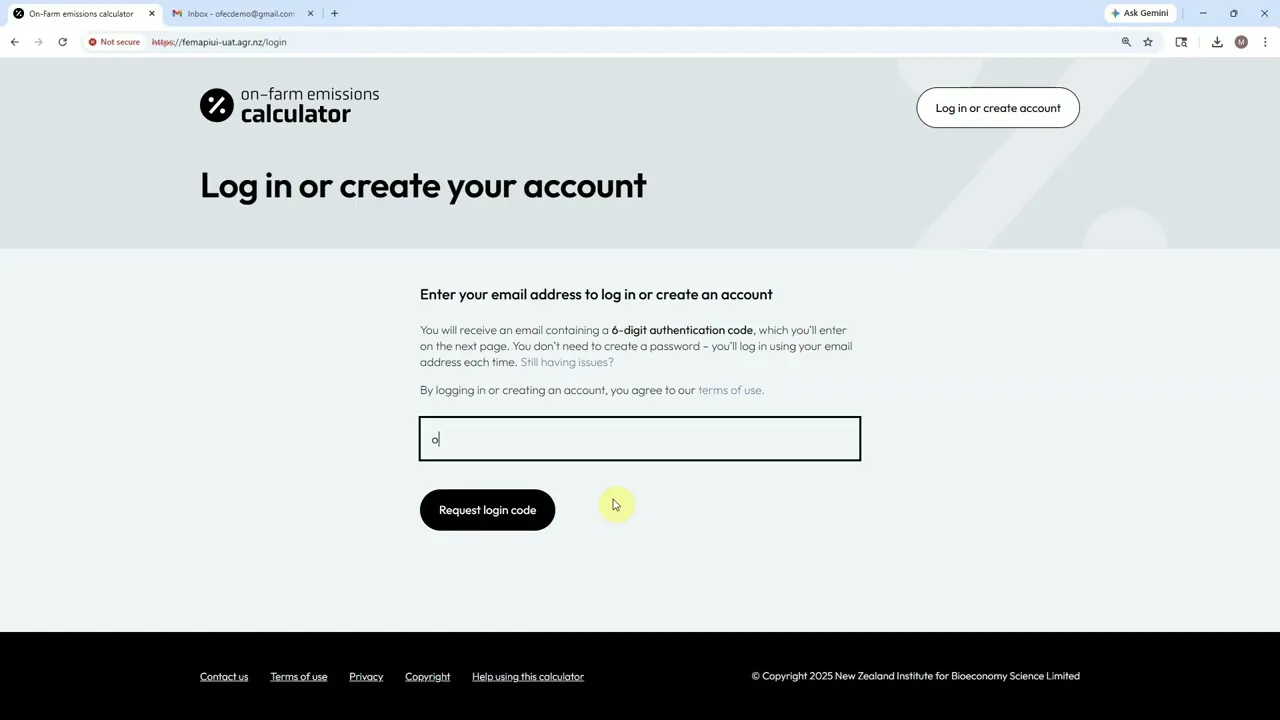
How do I log in?
Just enter your email address and we’ll send a six-digit onetime passcode. No password needed.
I’ve forgotten my login details — now what?
You only need your email. We’ll send a fresh onetime passcode each time.
Can I manage more than one farm?
Yes. You can create separate reports for each farm and switch between them within your account.
I didn’t get my onetime passcode email — what should I do?
If you requested a onetime passcode but haven’t received it, here are a few things to check:
- Spam or junk folder: Sometimes the email gets filtered out. If you find it there, mark it as “Not Spam” so future emails land in your inbox.
- Email address typo: Double-check that you entered your email correctly. If there’s a mistake, try again with the correct address.
- Corporate or school email filters: Some email systems block login emails. If possible, try using a personal email address or contact your IT team.
- Wait a minute, then retry: Occasionally, there’s a short delay. If it doesn’t arrive within a few minutes, try requesting the code again.
What farm information do I need to get started?
You’ll need:
- Region and farm class
- Farm area, if you wish to see your results on a per effective hectare basis
- What fertilisers you’ve purchased (or are planning to purchase)
- Stock numbers and classes, including breed, actual or anticipated movements, deaths, and births
- What feed you’ve used (or are planning to use)
- Milk production details (dairy farms only)
- Daily average hours in off-paddock structures connected to effluent management systems (dairy farms only)
- Details about your emission reducing tools and methods, such as EcoPondTM treatments and nProve Methane scorecard (sheep with low methane genetics)
Can I use estimates instead of exact figures?
Yes — estimates are fine. The more accurate your data, the more precise your results.
How long will it take to get my results?
Most calculations take about 5 to 10 seconds once your data is entered.
How are my emissions calculated?
The Calculator uses the Farm Emissions Method (FEM), combining your livestock & fertiliser farm data with emission factors to estimate methane, nitrous oxide and direct carbon dioxide emissions. Results are shown by gas type.
How is the Farm Emissions Method (FEM) different from other countries’ tools?
FEM is built for New Zealand’s pasture-based systems and is based on New Zealand’s National Greenhouse Gas Inventory. It separates methane and nitrous oxide and uses local data, unlike overseas tools that often rely on global averages or regulatory frameworks.
The emissions calculator can recognise on-farm actions that are known to reduce greenhouse gas emissions. These are only applied when you enter the relevant information for your farm.
The calculator currently includes the following mitigation options:
Urease inhibitors
Urease inhibitors are used with urea fertilisers to slow the conversion of urea once it is applied to pasture. This reduces nitrous oxide emissions from fertiliser use. When the use of urease‑treated fertiliser is recorded, the calculator reflects the lower emissions associated with this practice.
Low methane genetics (Sheep only)
This reflects the use of animals bred to produce less methane. If you provide breeding value information, the calculator adjusts methane emissions to reflect the benefit of using these animals.
EcoPondTM effluent treatment
EcoPondTM treatment reduces methane emissions from effluent ponds. When you record EcoPondTM use, the calculator allows for lower emissions from treated effluent.
Find out more about EcoPondTM.
Solid separators
Solid separators reduce emissions by separating solids from liquid effluent before storage. If solid separators are used on your farm, the calculator reflects the reduced emissions from effluent management.
For more information on strategies for reducing on-farm emissions visit the Ag Matters website.
What is a methane scorecard?
A methane scorecard is produced by the nProve Tracker which assesses the genetics of your sheep flock. The scorecard displays the net methane emissions for each class within your flock, expressed as a breeding value. A negative percentage value indicates a stock class is emitting less methane than the national average. These values, and the underlying genetic database has been developed by the Cool Sheep Programme.
How do I get a methane scorecard?
You will need to go to the nProve Tracker and register there to complete the assessment. Once completed, you can generate a methane scorecard, and the net methane emissions percentages can be entered into the calculator.
What is EcoPond™?
EcoPond™ is an effluent pond treatment service that reduces methane emissions by over 90%. EcoPond works by 'dosing' your effluent pond with chemicals, which dramatically reduces methane production, alongside other benefits.
To include EcoPond™ within your emissions report, simply add the treatment or dosing dates as part of the effluent management inputs. If you don't have the dates on hand, feel free to click the continuous treatment checkbox – which will automatically include effluent treatment dates for the year.
Find out more about EcoPondTM.
Can I enter data for future years?
Yes, the Calculator accepts dates up to 4 years from the current calendar year. You can also enter data for previous years.
What stock classes do I have?
Stock classes have been developed in partnership with industry, and reflect the most commonly used classifications by Inland Revenue, MPI and Agritech companies such as Farmax. For more information on stock classes, please refer to appendix two of MPI’s technical documentation, available on the MPI website.
How do I enter my data?
We have a handy guide on how to enter your data. Or watch a short video for step-by-step instructions.
What are some examples of supplementary feeds?
Concentrates
Feeds that are typically higher in energy and fed in smaller amounts e.g.
- Barley grain
- Palm kernel extract (PKE)
- Molasses
- Brewers grain
- Soyabean meal
Conserved feeds
Feeds that have been harvested and stored for later use e.g.
- Maize silage
- Pasture hay
- Lucerne baleage
Forage crops and herbs
Feeds grazed in situ or harvested for feeding e.g.
- Fodder beet
- Kale
Horticultural and vegetable by‑products
Feeds derived from other agricultural or food production processes:
- Apples
- Potatoes
What is dry matter (DM) and why does it matter?
Dry matter refers to the portion of feed that remains after all water is removed. It’s the nutrient-rich component animals actually consume, and it’s a key metric for estimating feed availability, productivity, and greenhouse gas emissions.
How do I calculate dry matter?
Refer to the NZ Grass-Fed Administrative Standards. Schedule 1 of the meat standard, and schedule 2 of the dairy standard, outlines the percentage dry matter for different feed types.
Why is the calculator updated?
The Farm Emissions Method (FEM) is updated as science, data, and calculation approaches improve. Using defined updates helps ensure each calculation is clear, consistent, and can be understood later.
Will my past reports change when the calculator is updated?
It depends. Past calculations stay linked to the method that was used at the time. Major updates to the calculator do not automatically change or overwrite previous reports, but minor fixes that correct errors in the calculations will be automatically applied when you open your report.
Can I rerun my farm after an update?
Yes. You can choose to rerun your farm information using the latest calculator update if you want to see how changes to the method affect your results.
Why can results differ between updates?
Differences can occur because updates may include improved reference data, refined calculations, or newly recognised practices. This is expected, which is why the calculator shows which FEM version was used for each report.
What is a legacy report?
A legacy report is a past report that was created from an earlier version of the calculator. These reports are no longer editable but you can still view the results. You will need to make a copy of the report to make any changes and it will be run under the latest FEM version.
What does FEM version mean?
FEM version refers to the Farm Emissions Method version used by the calculator to generate your results. Each report includes the specific FEM version number it was generated with, for transparency and reference.